Stylized blue icon of a data dashboard with charts and graphs.

Modern data exploration and visualization platform

Seven colored buttons labeled Data Hierarchy, Data Modeling, Cloud Connectivity, Composition Analysis, Data Visualization, Custom, and Data Governance, each with corresponding icons.
BI Dashboard Analytics

Configurable Business Intelligence pre-packaged in your AI data cloud

User-defined intelligences
Drag & drop
Easy integrations
Modular & configurable
All-in-one insights dashboard

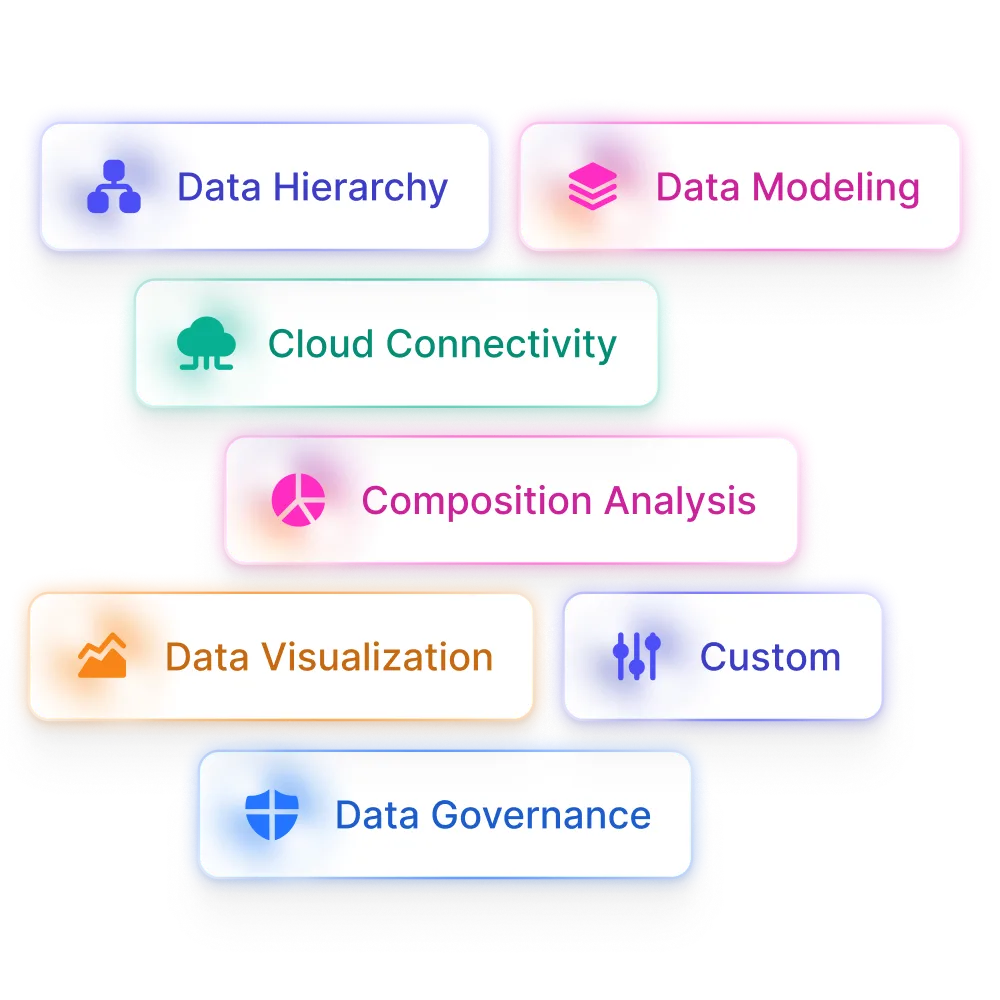
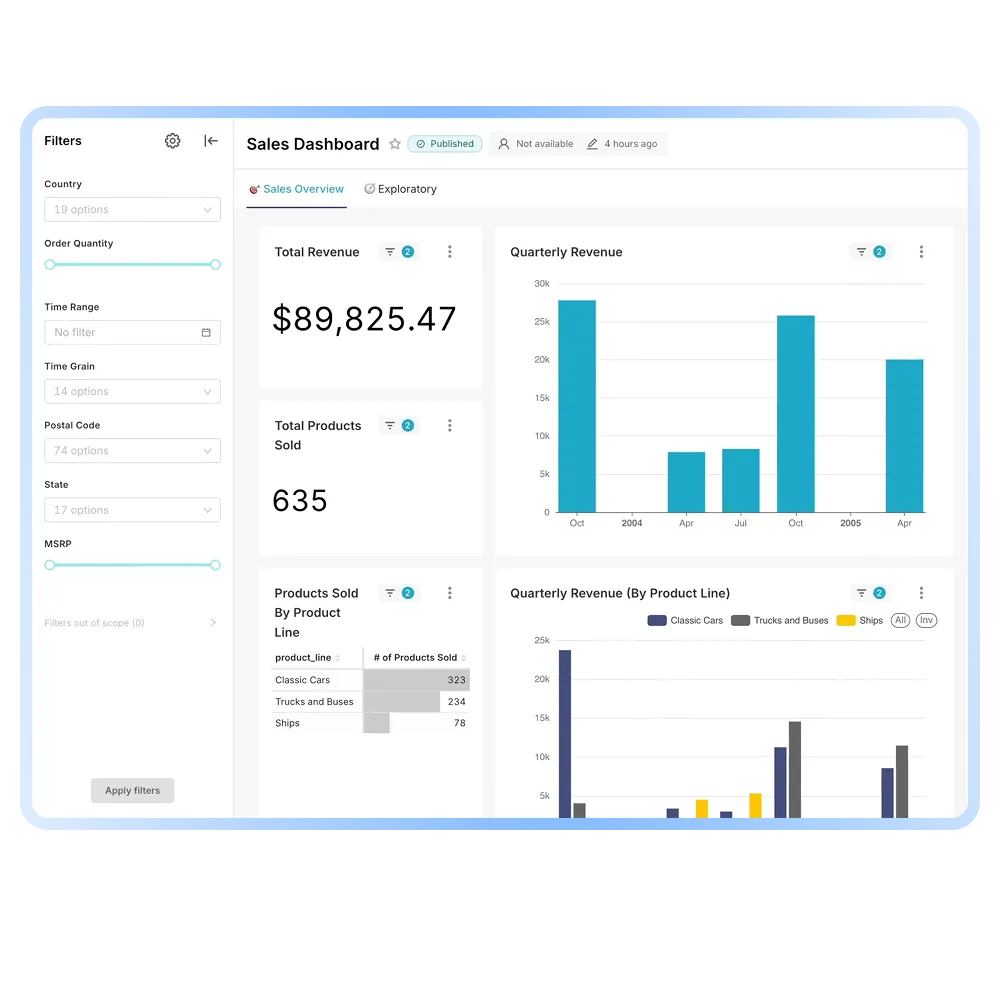
Every insight you need all in one dashboard. Pull any data variables or data tables to maximize business intelligence.

Insights without hassles

Asoka database and omnichannel integrations already built into the business intelligence module, enabling easy setup.

Scale without concern

Asoka handles millions of data points with scalable and modern architecture designed for both enterprises and SMEs.

Drag & Drop Builder

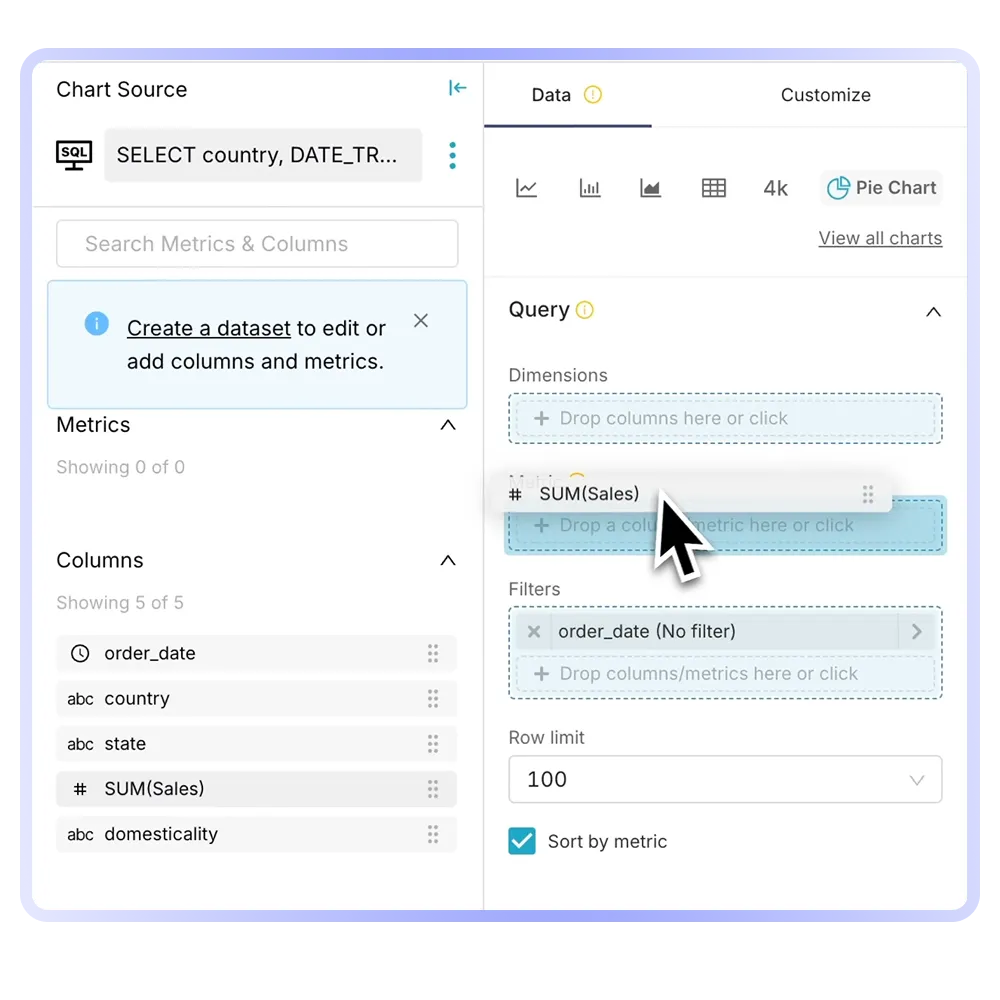
Modular BI Dashboard Builder

Build dashboards quickly using an intuitive drag-and-drop interface. Connect directly to your data and visualize insights in minutes.

Get a demo
User interface of a data visualization tool showing SQL query selection, metrics and columns with filters; SUM(Sales) metric highlighted by a cursor.
Table showing quarterly sales data with columns for order date, price each, sales, address lines, and contact last name, with a cursor selecting 'Drill to detail' in a cross-filter menu.
Data Drilldown

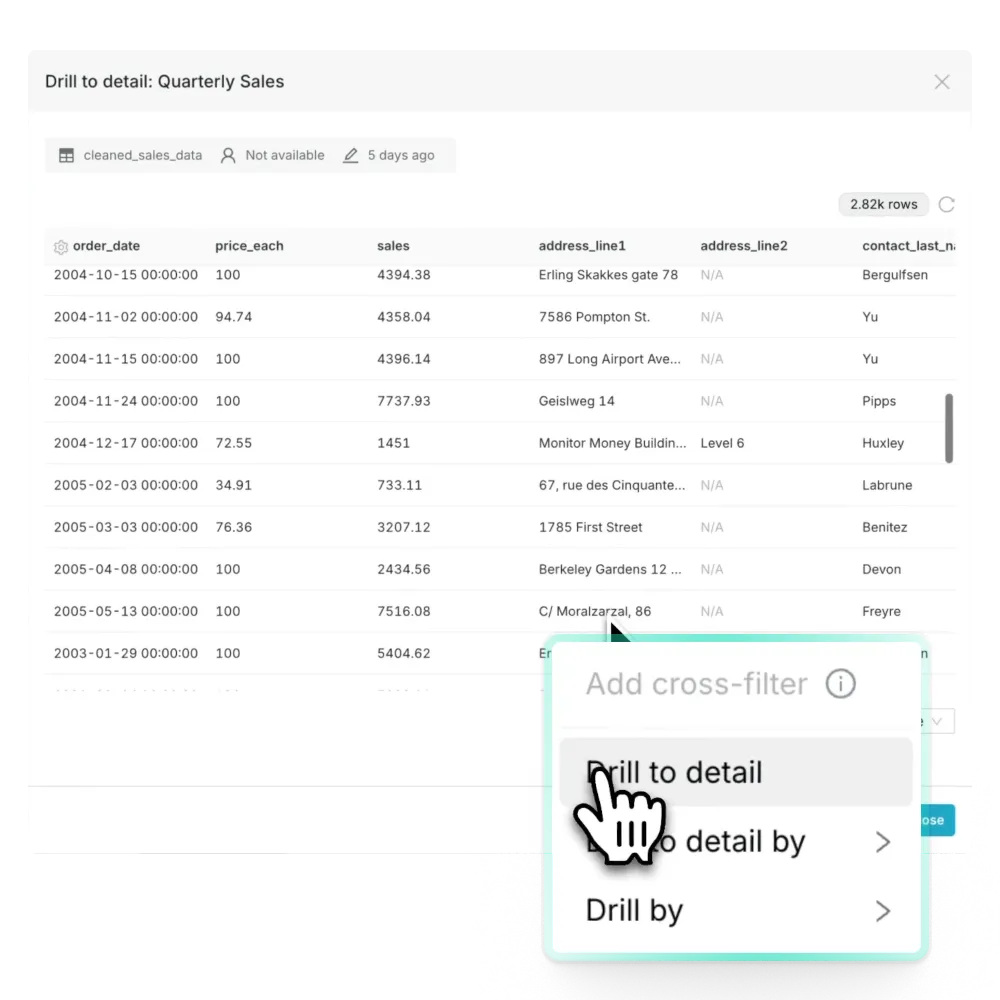
Interactive Data Drilldowns

Explore metrics at any level of detail. Click through charts to uncover trends, anomalies, and root causes.

Get a demo
Custom Visualizations

Easy interfaces with calendars and Gantt views

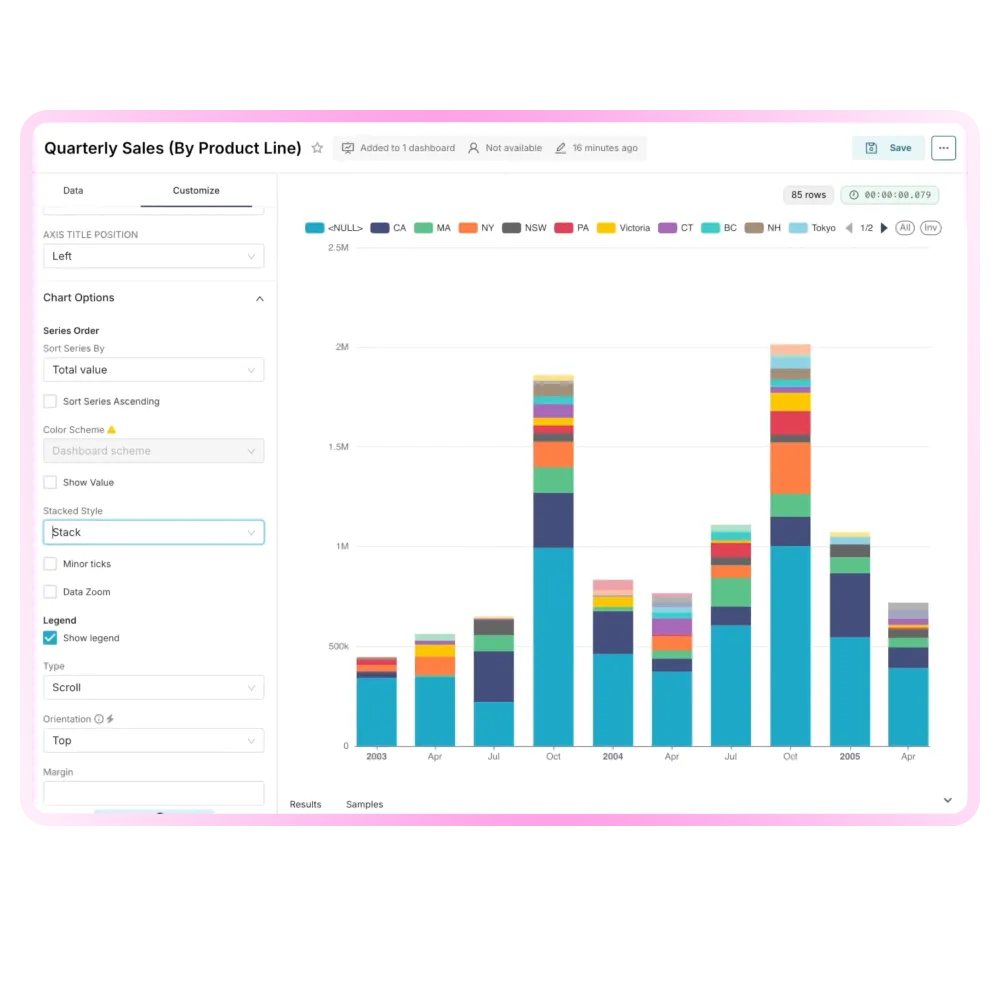
Create charts and dashboards tailored to your business needs. Customize layouts, metrics, and filters with full flexibility.

Get a demo
Stacked bar chart titled 'Quarterly Sales (By Product Line)' showing sales data by product line and region from 2003 to 2005 with customization options on the left panel.
Sales dashboard displaying total revenue $89,825.47, total products sold 635, bar charts of quarterly revenue, and product sales by category with filters for country, order quantity, time range, time grain, postal code, state, and MSRP on the left.
User friendly

Built for Business Users

Powerful analytics without the learning curve. Designed for teams to explore data without technical expertise.

Get a demo

Asoka deploys next generation AI Agents.

Chat with all your software and databases at need.

One AI Work Platform that works.